
Completion rate
How much of what you plan actually gets done.
Free plan forever · 15-day Pro trial
See tasks completed, completion rate, active days and your daily goal streak, over 7, 30 or 90 days or all time.
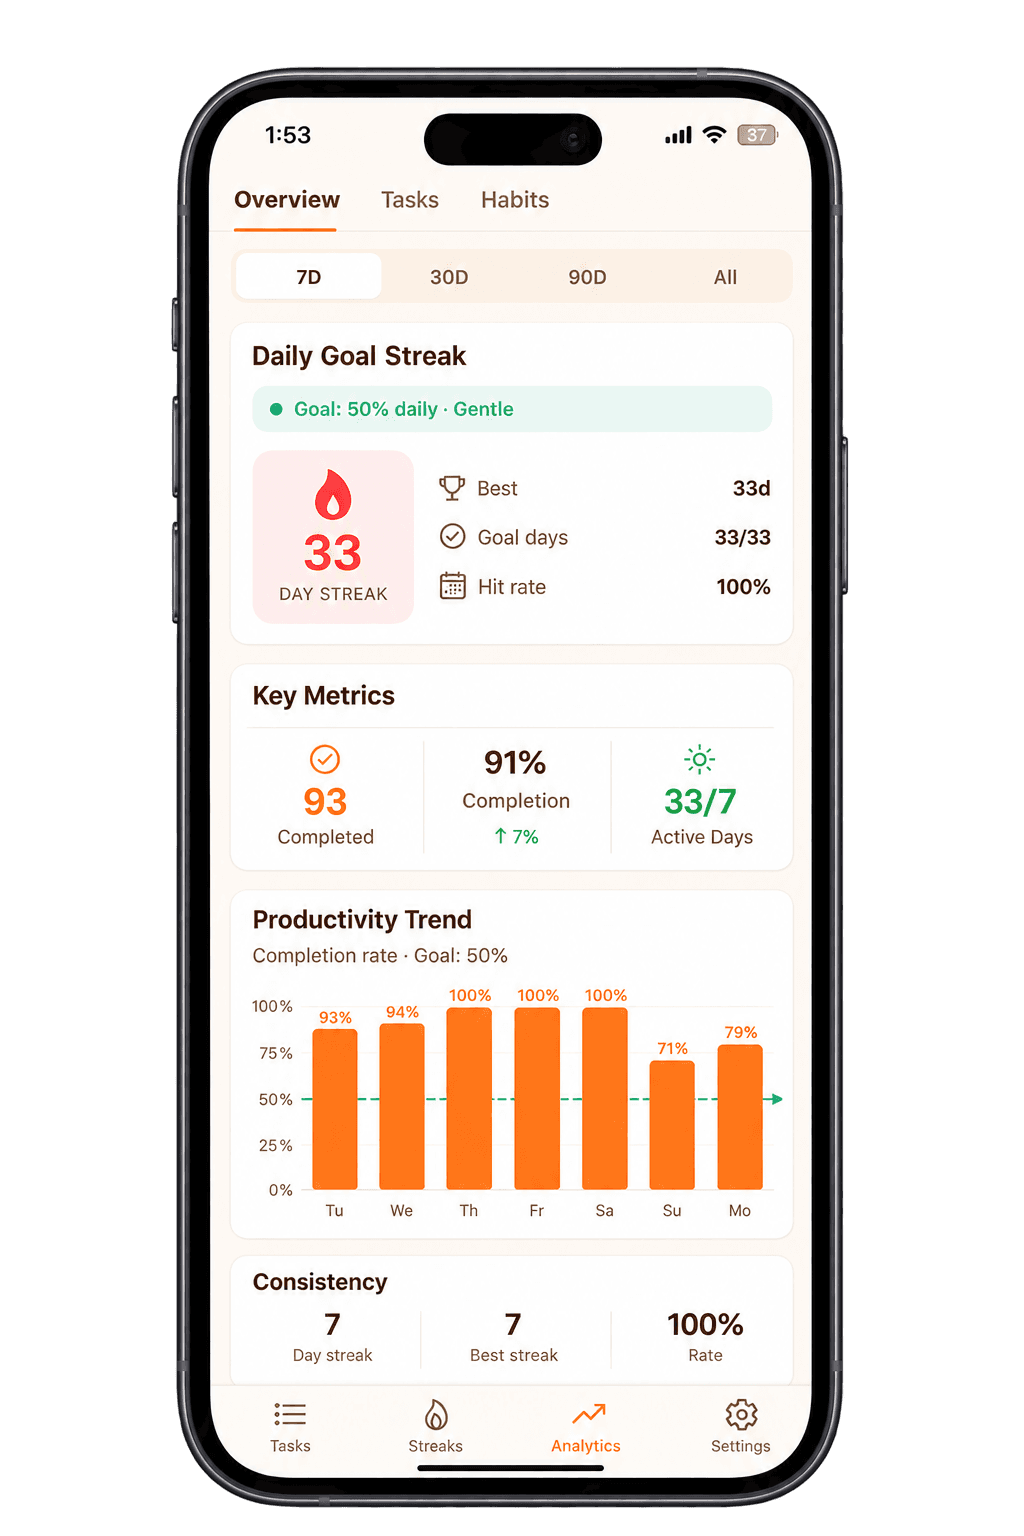
Streaks show consistency. Analytics show the full picture.
How much of what you plan actually gets done.
Weekly charts show when you're on a roll and when you slip.
How often you show up, not just how much you do.
Track progress toward the daily completion goal you set.
Every completion is recorded automatically.
7, 30 or 90 days, or all time.
Use the numbers to plan a more realistic, consistent week.
See if the study plan is actually happening.
Spot busy weeks and plan around them.
Check which routines stick.
Keep an eye on output across clients.
Quick answers about this feature. Still stuck? Visit the help centre or contact us.
Productivity analytics helps you understand how consistently you complete tasks and how your activity changes over time. Instead of relying on memory, you look at actual completion data — how many tasks you finished, how often you hit your daily goal, and how active you have been across days and weeks.
Yes. Taskke is a free productivity tracker app for Android that turns the tasks you complete into analytics: tasks completed, completion rate, active days, a daily goal streak, and a productivity trend chart across 7, 30, or 90 days or all time.
Taskke's free plan includes analytics with some limits. Taskke Pro ($2.99/month or $24/year) unlocks full analytics, and new users get a 15-day free Pro trial.
No. Taskke analytics are based only on tasks you actually complete. Active days counts the days with at least one completed task — it does not measure screen time, app usage, or how long you spent working.
Taskke analytics shows your completed task count, completion rate (with a trend indicator), active days, day streak, best streak, hit rate, and a Productivity Trend chart. It also shows your Daily Goal Streak — including current streak, best streak, goal days, and hit rate.
Yes. Taskke records your task completions automatically. The Analytics view lets you review your completion rate, completed count, and productivity trend across 7D, 30D, 90D, and All Time ranges.
Yes. The Productivity Trend section shows a bar chart of your daily completion rate across the selected time range, with a reference line marking your daily goal. This makes it easy to see which days you were above or below your target.
Taskke analytics offers four time ranges: 7D (last 7 days), 30D (last 30 days), 90D (last 90 days), and All Time. You can switch between them to see your completion data from different perspectives.
Yes. The analytics view shows your current day streak and best streak as part of the Daily Goal Streak section. The individual streak details screen — accessible via the Streaks tab — also shows a calendar history of your completions.
Yes. The Key Metrics section in Taskke analytics shows your active days — the number of days within the selected time range on which you completed at least one task.
Yes. If you use recurring tasks, your completions of those tasks feed into your analytics automatically. You can see how your completion rate and active day count look over time, which gives you a picture of how consistently you are completing your recurring responsibilities.
Yes. The Daily Goal Streak section tracks how consistently you are meeting your daily completion goal. It shows your current streak, best streak, the number of goal days, and your hit rate — all based on whether you reached your daily goal percentage each day.
Yes. Every recurring habit you complete feeds into your stats — completion rate, active days, goal days, and streaks — so Taskke works as a habit tracker with statistics as well as a task tracker.
Every task completion in Taskke feeds automatically into analytics — no separate setup. The Analytics tab collects your completion activity and presents it as key metrics, a productivity trend chart, and daily goal streak data. You manage tasks in the task list; analytics reflects what happened.
Yes. Students can use analytics to track how consistently they are completing study sessions, revision tasks, and daily routines. The completion rate and active day count help show whether a study routine is actually holding over a week or month.
Task tracking manages today's work — you add tasks, complete them, and plan your day. Analytics reviews your work over time — completion rate, active days, trends, and streaks. Taskke connects both: complete tasks with the task list; understand your patterns with analytics.

Free on Android. Your habits, tasks and streaks in one place, and your AI app can help too.