
Productivity Tracker AppSee Your Productivity With Task Analytics
Taskke is a free productivity tracker app for Android. It turns the tasks and habits you complete into clear stats — completion rate, active days, and daily goal streaks — so you can see how you actually work over time, not just what you planned.
Free on Google Play · Android phones & tablets
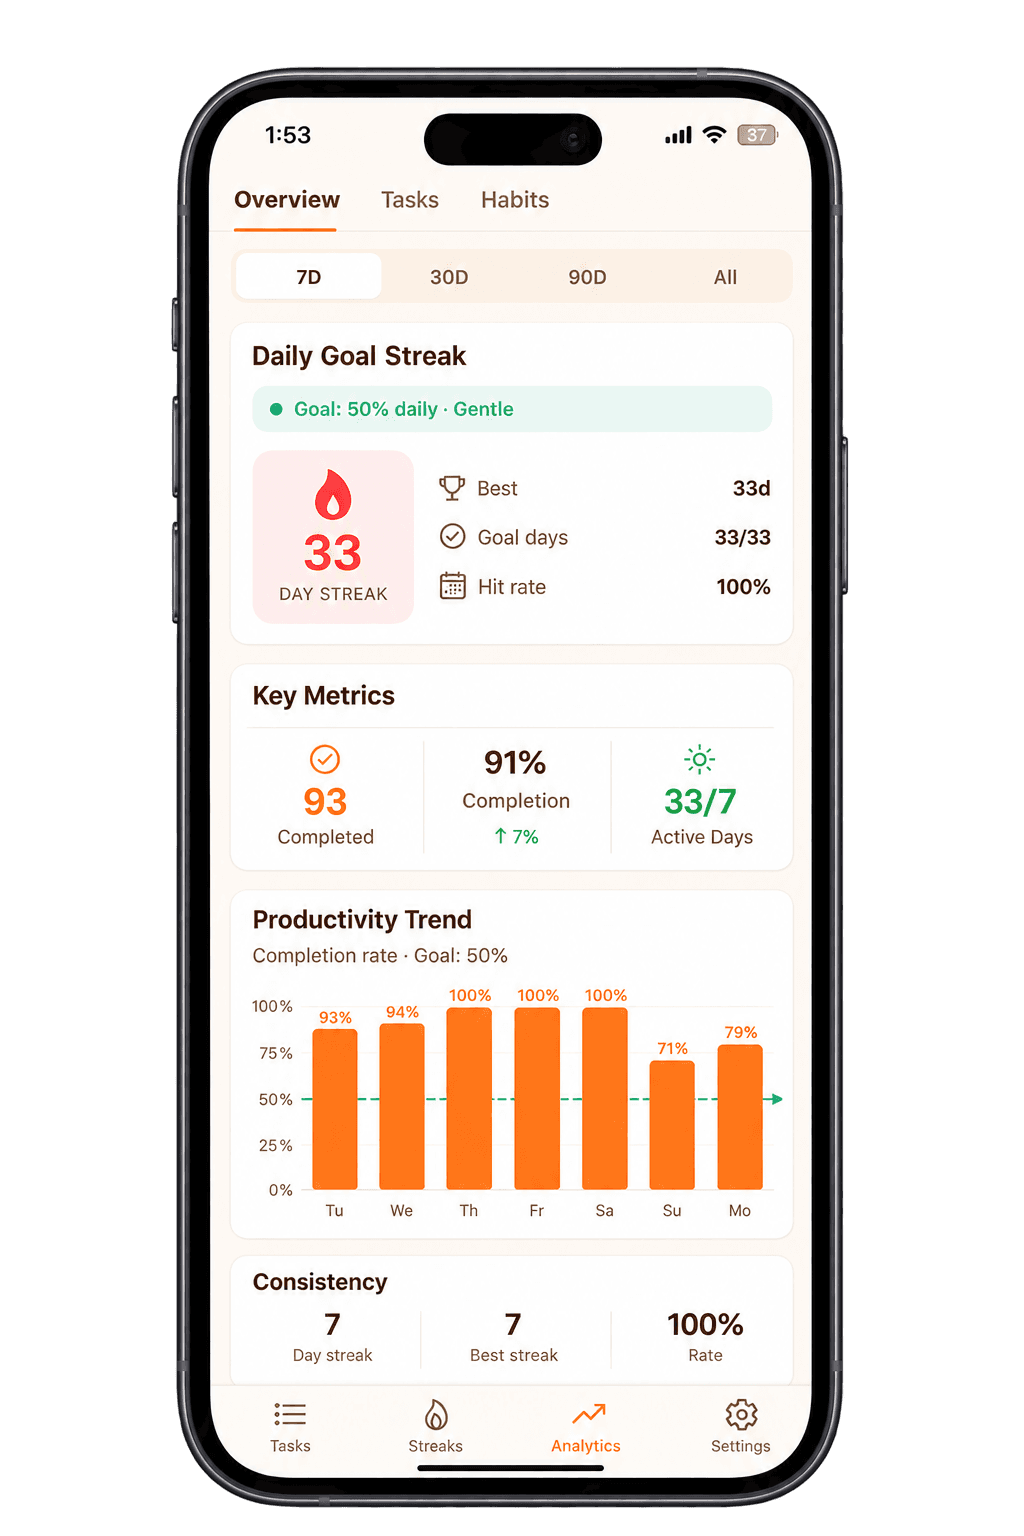
- Productivity trend chart
- Completion rate
- Active days
- Day streaks
- Calendar history
- 7D · 30D · 90D · All Time
What Is Productivity Analytics?
Productivity analytics helps you understand how consistently you complete tasks and how your activity changes over time. Rather than relying on memory or gut feeling, you look at actual completion data — how many tasks you finished, how often you hit your daily goal, and how active you've been across days and weeks.
In Taskke, analytics is tied directly to task completion. When you complete tasks, that activity feeds into your analytics automatically — giving you a completion rate, active day count, productivity trend chart, and streak data, all in one view.
Taskke's productivity tracker at a glance
- Price
- Analytics included free; full analytics in Pro
- Platform
- Android phones and tablets
- Time ranges
- 7 days, 30 days, 90 days, or all time
- Key metrics
- Tasks completed, completion rate, active days
- Daily goal
- Current & best streak, goal days, hit rate
- Trend chart
- Daily completion rate vs your goal line
- Data source
- Only tasks you complete — no screen time
- Setup
- Automatic, no manual logging
Turn Completed Tasks Into Useful Insights
A task list answers: “What do I need to do?” Completion answers: “What did I actually finish?” Analytics answers: “What does my work look like over time?”
Taskke connects all three layers. Every task you complete feeds into your analytics automatically — no separate logging, no manual data entry. Over time, the picture builds into something you can actually learn from.
Task list
“What needs to be done?”
Organize and plan the work, routines, and responsibilities you want to follow through on.
Completion
“What did I actually finish?”
Checking off a task records a real completion — not just an intention.
Analytics
“What does my activity look like over time?”
Completion data becomes trends, rates, and streak counts — a real view of how you work.
See the Metrics Behind Your Progress
Taskke's analytics view surfaces the numbers that matter most for understanding your task completion and consistency — without fabricating scores or estimates.
Completed
The total number of tasks you have completed within the selected time range.
Completion Rate
The percentage of your tasks completed relative to the total available — shown with a trend indicator.
Active Days
How many days within the selected range you completed at least one task.
Day Streak
Your current consecutive-day streak — how many days in a row you have met your daily goal.
Best Streak
The longest consecutive-day streak you have achieved.
Hit Rate
How often you hit your daily goal within the time range — shown as a percentage of goal days.
Understand Your Completion Trends
The Productivity Trend chart shows your daily completion rate as a bar chart across the selected time range. A reference line marks your daily goal, so you can see at a glance which days you were above or below your target.
This makes it straightforward to spot consistent days, dips, and changes in your work pattern — without needing to dig through individual task lists.
- Daily completion rate per day
- Goal reference line at your target percentage
- Visual bar chart across the selected period
- Changes across different time ranges
Review Your Progress Across Different Time Ranges
Switch between four time ranges in Taskke analytics to see your completion data from the perspective that is most useful to you right now.
Last 7 Days
See your most recent activity. Useful for checking how the past week has gone and whether your current routine is holding.
Last 30 Days
Get a broader monthly view of your completion rate, active days, and streak performance across a full month.
Last 90 Days
Look at longer-term consistency. A 90-day view shows whether your productivity patterns are holding or shifting over time.
All Time
See your cumulative completion history since you started using Taskke — your full activity record.
Track Progress Toward Your Daily Goal
The Daily Goal Streak section in Taskke analytics shows your current day streak, best day streak, goal days, and hit rate — based on a daily completion percentage you can configure as your consistency target.
When you complete enough of your daily tasks to meet the goal percentage, that day counts toward your streak. This lets you measure overall consistency rather than chasing a perfect completion rate every single day.
Daily Goal Streak — what you can see
Current consecutive-day streak toward your daily goal.
Your longest daily goal streak on record.
How many days in the range you hit your daily goal.
The percentage of days within the range you met your goal.
See How Often You Stay Active
Active days shows how many days within the selected time range you completed at least one task. It is a straightforward measure of how consistently you are showing up — regardless of how many tasks you complete on each day.
It does not measure screen time, app usage, or how long you spent working. It is simply a count of days with real task completions.
Active days
Days with at least one completed task in the selected range.
Completion rate
Percentage of tasks completed, shown with a trend direction.
Completed
Total number of individual task completions in the range.
Day streak
Current consecutive days hitting your daily goal.
Streaks Tell You About Consistency. Analytics Shows the Full Picture.
Your streak tells you how many consecutive days you have met your daily goal. Analytics gives you a broader view — completion rate, active day count, trend chart, and goal day history — all within the same screen.
The two work together naturally. Streaks highlight your current run of consistency. Analytics puts that streak in context, showing how it has built over time and how your completion rate has changed.
Streak
Consecutive days meeting your daily goal
Shows your current run of consistency
Analytics
Completion rate, active days, trend, and goal history
Shows the broader pattern your streak is part of
Together
Streak in context with your full completion history
See both how long you've held consistency and how your rate is trending
How Taskke Analytics Works
Create and organise tasks
Add your tasks, set recurring schedules where needed, and organise them into your daily routine.
Complete tasks as you work
Check off tasks when done. Each completion is recorded as real task activity.
Taskke records the completion activity
Your completion data feeds automatically into analytics — no separate logging needed.
Review your trends and consistency
Open the Analytics tab to see your completion rate, active days, productivity trend, and streak data across any time range.
What Can You Learn From Your Task Data?
Taskke analytics is built to answer concrete questions about your actual task completion — not abstract productivity scores. Here are the kinds of questions it helps you answer.
- How consistently am I completing tasks?
- How many tasks have I completed in the last 7 or 30 days?
- How many days have I been active this month?
- How long has my current daily goal streak lasted?
- What does my recent completion rate trend look like?
- How does my activity compare across 7D, 30D, 90D, and All Time?
- How often am I hitting my daily goal?
- What is my best streak so far?
Task Tracking vs. Productivity Analytics
Both have their place. Understanding the difference helps you use Taskke to its full potential.
Manage today's work
- Add and organise tasks
- Mark completions
- Plan your day
- Focused on the present
Understand your work over time
- Completion rate and trends
- Active days and streaks
- Productivity trend chart
- Historical perspective
Both in one place
- Create and complete tasks
- Analytics updates automatically
- Task management + progress review
- No separate setup
How Analytics Connects to the Rest of Taskke
Analytics does not work in isolation. It builds on top of your task completions across every part of Taskke.
To-Do List
The task list is the working layer. Each task you complete feeds into your analytics. Analytics is the review layer that builds on top of your daily task activity.
Explore To-Do ListTask Planner
Planning defines what you intend to accomplish. Analytics helps you review what you actually completed — a useful way to see how closely your activity follows your plans.
Explore Task PlannerRecurring Tasks
Recurring tasks create repeated responsibilities. Analytics lets you look back at how consistently you have been completing them — turning a schedule into a trend.
Explore Recurring TasksReminders
Reminders help you remember tasks at the right time. Analytics helps you review what happened after — giving you a picture of your completion activity over time.
Explore RemindersStreaks
Streaks track your current run of consistent days. The analytics view shows your daily goal streak alongside your broader completion data — both in the same screen.
Explore StreaksGroup Streak
Group streaks track shared consistency goals across a group of tasks. Analytics provides the individual completion context that sits alongside your group tracking.
Explore Group StreakWho Can Use Productivity Analytics?
Productivity analytics is useful for anyone who wants to understand their task completion over time — not just what they plan to do, but what they actually follow through on.
Students
Track study session completion, see whether a revision routine is holding, and review how active you have been across an exam period.
Taskke for studentsFreelancers
Review work task completion across client projects, spot consistency patterns in your daily output, and monitor your productivity trend over weeks.
Taskke for freelancersEntrepreneurs
See how consistently high-priority tasks are being completed, review trends across different time ranges, and track daily goal streaks for key routines.
Taskke for entrepreneursProfessionals
Review task completion trends, monitor active days, and use analytics to see whether your work routines are consistent across weeks and months.
Taskke for professionalsPersonal routines
Whether you are tracking exercise, reading, journaling, or any other personal habit, analytics gives you a clear picture of your completion over time.
Taskke for personal routinesHow People Use Taskke Analytics
Study progress
See how consistently you are completing study sessions and revision tasks. Use the 30D view to check whether your study routine is holding across a full month.
Work task completion
Track how many work tasks you complete each week, monitor your completion rate, and review your active day count to understand your work patterns.
Recurring routines
Recurring tasks create the schedule. Analytics shows whether you are following through — completion rate, active days, and trend across the full history.
Project consistency
Review how consistently you complete project-related tasks over time. The 90D view is useful for seeing whether longer-term work stays on track.
Daily planning review
After planning your day with the task planner, analytics lets you review whether you completed what you planned — across days, weeks, and months.
Personal productivity
Whether personal or professional, analytics gives you a factual picture of your task completion and consistency — without estimates or invented scores.
Explore More Taskke Features
Analytics
Questions
Common questions about productivity analytics in Taskke. Contact us if yours isn't here.
Productivity analytics helps you understand how consistently you complete tasks and how your activity changes over time. Instead of relying on memory, you look at actual completion data — how many tasks you finished, how often you hit your daily goal, and how active you have been across days and weeks.
Yes. Taskke is a free productivity tracker app for Android that turns the tasks you complete into analytics: tasks completed, completion rate, active days, a daily goal streak, and a productivity trend chart across 7, 30, or 90 days or all time.
Taskke's free plan includes analytics with some limits. Taskke Pro ($2.99/month or $24/year) unlocks full analytics, and new users get a 15-day free Pro trial.
No. Taskke analytics are based only on tasks you actually complete. Active days counts the days with at least one completed task — it does not measure screen time, app usage, or how long you spent working.
Taskke analytics shows your completed task count, completion rate (with a trend indicator), active days, day streak, best streak, hit rate, and a Productivity Trend chart. It also shows your Daily Goal Streak — including current streak, best streak, goal days, and hit rate.
Yes. Taskke records your task completions automatically. The Analytics view lets you review your completion rate, completed count, and productivity trend across 7D, 30D, 90D, and All Time ranges.
Yes. The Productivity Trend section shows a bar chart of your daily completion rate across the selected time range, with a reference line marking your daily goal. This makes it easy to see which days you were above or below your target.
Taskke analytics offers four time ranges: 7D (last 7 days), 30D (last 30 days), 90D (last 90 days), and All Time. You can switch between them to see your completion data from different perspectives.
Yes. The analytics view shows your current day streak and best streak as part of the Daily Goal Streak section. The individual streak details screen — accessible via the Streaks tab — also shows a calendar history of your completions.
Yes. The Key Metrics section in Taskke analytics shows your active days — the number of days within the selected time range on which you completed at least one task.
Yes. If you use recurring tasks, your completions of those tasks feed into your analytics automatically. You can see how your completion rate and active day count look over time, which gives you a picture of how consistently you are completing your recurring responsibilities.
Yes. The Daily Goal Streak section tracks how consistently you are meeting your daily completion goal. It shows your current streak, best streak, the number of goal days, and your hit rate — all based on whether you reached your daily goal percentage each day.
Yes. Every recurring habit you complete feeds into your stats — completion rate, active days, goal days, and streaks — so Taskke works as a habit tracker with statistics as well as a task tracker.
Every task completion in Taskke feeds automatically into analytics — no separate setup. The Analytics tab collects your completion activity and presents it as key metrics, a productivity trend chart, and daily goal streak data. You manage tasks in the task list; analytics reflects what happened.
Yes. Students can use analytics to track how consistently they are completing study sessions, revision tasks, and daily routines. The completion rate and active day count help show whether a study routine is actually holding over a week or month.
Task tracking manages today's work — you add tasks, complete them, and plan your day. Analytics reviews your work over time — completion rate, active days, trends, and streaks. Taskke connects both: complete tasks with the task list; understand your patterns with analytics.
Complete Tasks. Understand Your Progress.
Start building your task completion history today. Taskke turns every completed task into real analytics — completion rate, active days, trends, and streaks, all in one view.